
A little room to wonder
DNA, Inheritance & Variation
DNA stores information in a sequence of bases. Inheritance can be modelled with probabilities, but real traits are not all controlled by one simple pair of alternatives.
What can a simple inheritance model predict, and what does it leave out?
 Zephyris · Source · CC BY-SA 3.0
From a sequence to a biological effect
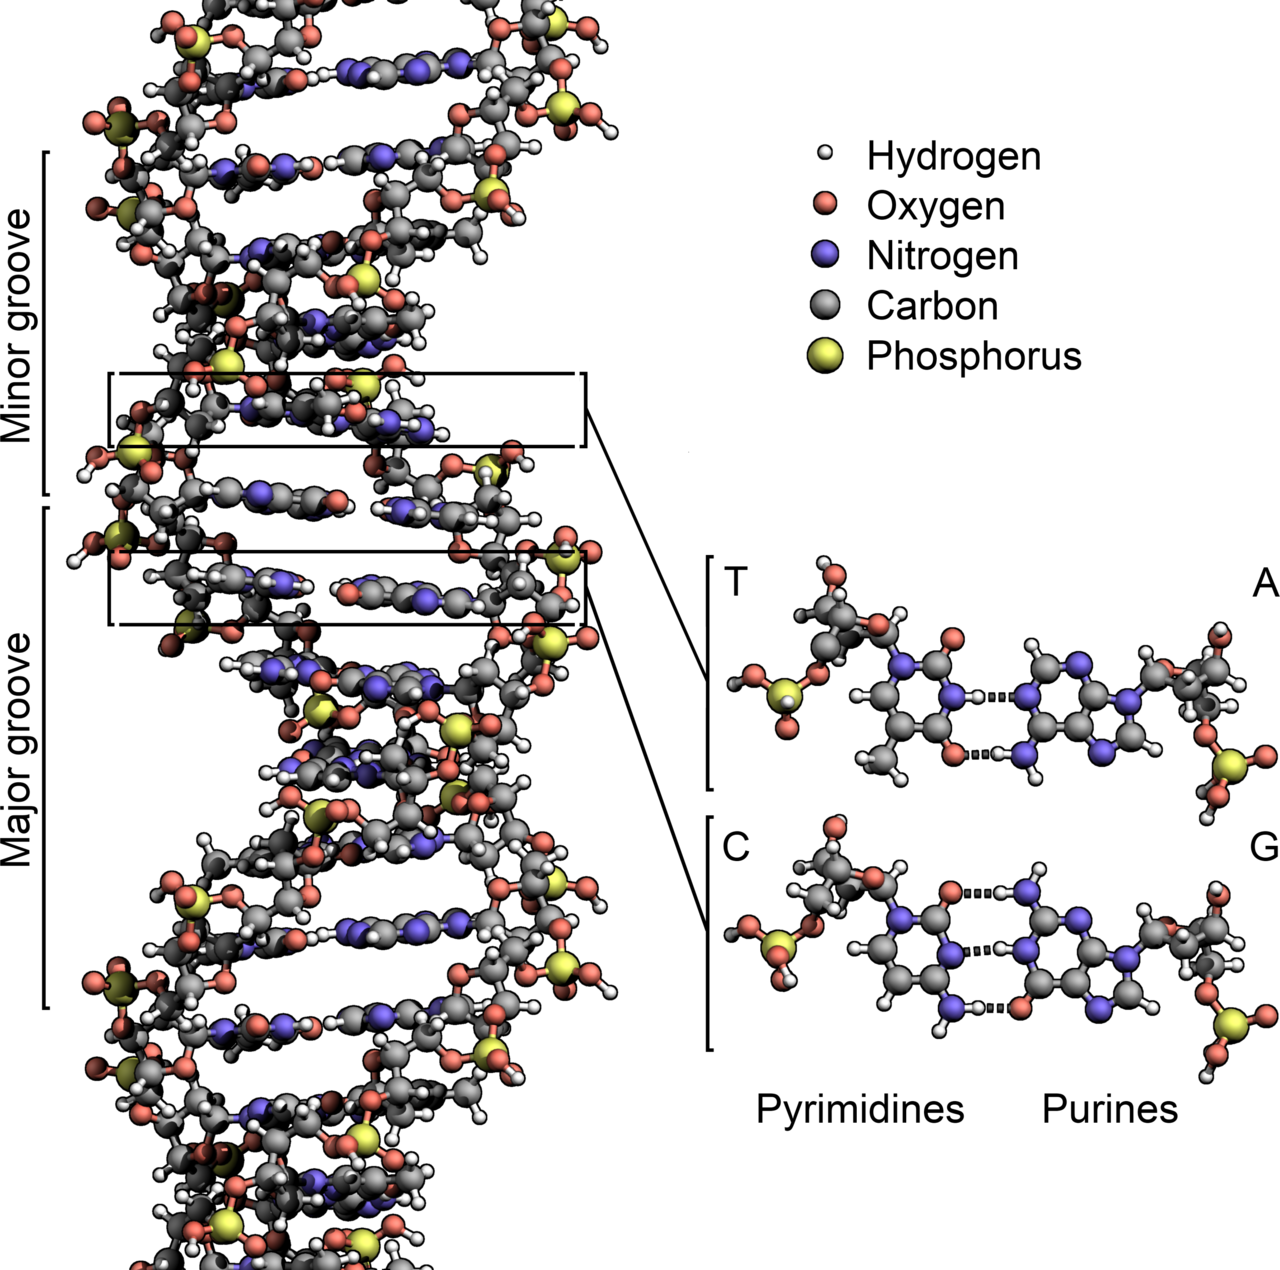
DNA is built from nucleotides containing bases represented by A, T, C and G. In its double-stranded form, complementary bases pair A with T and C with G. The sequence matters: the same kinds of building blocks can be arranged in different orders.
A gene is a region of DNA associated with a functional product. Different versions are called alleles. A change in DNA does not automatically produce a visible difference, and a visible difference does not identify its genetic cause without further evidence.
Separate the inherited combination from the observed trait
Genotype describes a genetic combination; phenotype describes an observable characteristic. In a simple complete-dominance model, one allele’s effect is visible when paired with another allele whose effect is not visible in that combination. “Dominant” does not mean stronger, better or more common.
Many traits involve several genes and environmental influences. Some inheritance patterns involve incomplete dominance, codominance or other complications. The two-letter model below is deliberately limited to one imagined trait; it is not a guide for predicting anybody’s health, identity or abilities.
Worked example: fictional seed pods
Suppose an invented plant has a pod-colour trait with alleles G and g. In this model, GG and Gg make green pods; gg makes pale pods. Cross a Gg plant with a gg plant. The first can contribute G or g with equal probability; the second contributes g. The possible combinations are Gg and gg, each with probability one half.
Four equally likely cells in a grid can be written Gg, Gg, gg, gg. That gives a model expectation of 50% green and 50% pale. It does not require the next four offspring to divide exactly two and two. Each outcome remains uncertain, and a larger sample can also depart from the expected proportion. The grid counts possibilities; it is not a timetable.
A model’s assumptions are part of its answer
The example assumes a single gene, two alleles, equal contribution probabilities and a particular dominance rule. Changing any of those assumptions may change the prediction. To investigate an actual organism, you would need evidence that the model fits the trait and the reproductive process.
DNA is shared through ancestry, while mutation and recombination contribute variation. Avoid turning a diagram into a ranking of organisms or people. You can explore the logic using fictional plants and symbols without collecting family histories, genetic samples or personal information.
Only if you feel like trying
Change one fictional cross
- Keep the invented G/g rule. Compare Gg × gg with GG × gg on paper or aloud.
- List every possible offspring combination. Explain why the second cross gives Gg in every cell of this model.
- Write one reason an actual trait might not follow this simple rule.
Optional. Work on paper, point to the example or talk it through. No account, purchase or public sharing is needed.
Look at the sources.
These references informed this introduction. You can check who published them, what evidence they use and whether you would ask another question.
- OpenStax, Rice UniversityBiology 2e: DNA Structure and Sequencing
- OpenStax, Rice UniversityBiology 2e: Characteristics and Traits
Research checked 1 November 2026. External pages have their own content and privacy practices.
Where could this connect?
These are editorial links between subjects. You choose which, if any, to follow.
Binary & Digital Data
Both biological and digital sequences use ordered symbols, but DNA is a physical biological system rather than ordinary computer code.
Follow this connection
Biology
Inheritance connects cellular information with variation across generations.
Follow this connectionProbability & Chance
An inheritance grid describes possible outcomes and expected proportions, not guaranteed small-sample counts.
Follow this connection