
A little room to wonder
Exoplanets & Detection
Read a transit-like light curve as evidence to investigate, using repeated timing and clearly stated simplifying assumptions.
What can a small dip in starlight tell us?
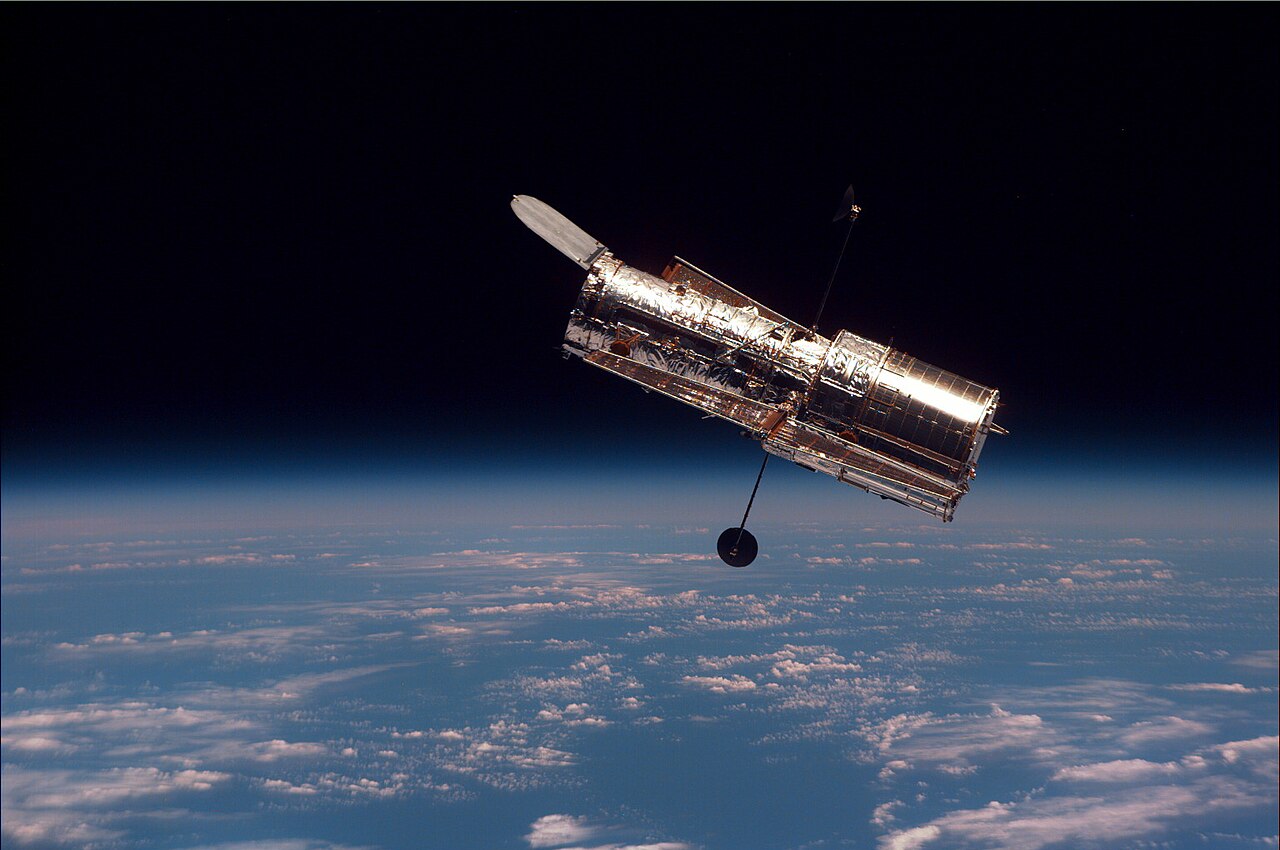
Detect an effect rather than a close-up
An exoplanet is a planet orbiting a star beyond our Solar System. A transit occurs when a planet crosses the star’s face from an observer’s viewpoint. The measured light can decrease slightly while the planet blocks part of the visible stellar disc.
A light curve plots received brightness against time. It is a measurement record, not the planet’s path across a page. A dip is a clue; identifying its cause requires checking the instrument, other possible sources of variation and whether the pattern repeats.
Define a baseline and a proportion
The baseline is the brightness used for comparison outside the proposed event. A drop from 1,000 units to 990 units is 10 units, or 1% of that baseline. Units here are invented detector counts, not a universal scale of stellar brightness.
In a simple model of an evenly bright stellar disc with a fully overlapping dark planet, the blocked fraction equals the planet-disc area divided by star-disc area. Because circle area depends on radius squared, the radius ratio is the square root of that fraction. Real analysis needs additional effects, including the star’s uneven apparent brightness.
Worked example: compare depth and timing
A fictional record has equal dips centred on days 2, 10 and 18. The intervals are 8 days and 8 days, suggesting an 8-day repeating event worth checking. Each event falls from 1,000 to 990 units: (1,000 − 990) / 1,000 = 0.01.
Within the stated uniform-disc model, a depth of 0.01 corresponds to a planet-to-star radius ratio of 0.1, because 0.1² = 0.01. That is a relative size, not a radius in kilometres. The timing alone also does not provide an orbital distance without further information about the system.
A method sees a selected kind of system
A planet whose orbit never crosses the star’s face from our direction will not produce this transit signal. A set of transit detections therefore is not a complete inventory of every kind of planetary orbit. Absence of a dip does not prove absence of a planet.
The example is a deliberately clean calculation, not a discovery claim. Repetition and consistent depth strengthen a question, but do not eliminate every alternative explanation. Scientists combine modelling, further observations and other detection methods rather than treating one striking graph as a verdict.
Only if you feel like trying
Read a fictional light curve
- Sketch brightness values of 1,000 outside events and 990 at days 2, 10 and 18. Label both axes.
- Calculate the percentage drop and the two intervals without assuming the dip already proves a planet.
- Add one missing observation and explain how it limits confidence about the repeating pattern.
Optional. Use paper or talk through the supplied fictional example. No purchase, personal information, account, public sharing or practical experiment is needed.
Look at the sources.
These references offer further reading on the ideas here. Check who published them, what they support and what you would ask next.
Research checked 1 November 2026. External pages have their own content and privacy practices.
Where could this connect?
These are editorial links between subjects. You choose which, if any, to follow.
Astronomy
Exoplanet detection shows how astronomers infer a distant object from a measurable effect.
Follow this connection
Ratio & Proportion
Transit depth is a proportion, and an area ratio differs from a radius ratio.
Follow this connectionStatistics & Data
A graph needs a baseline, repeat observations and checks for missing or unusual measurements.
Follow this connection