
A little room to wonder
Water Networks & Flow
Track volume through a fictional network using explicit inflows, outflows and storage, without assuming every branch gets the same share.
Where must incoming water go when a model has more than one route?
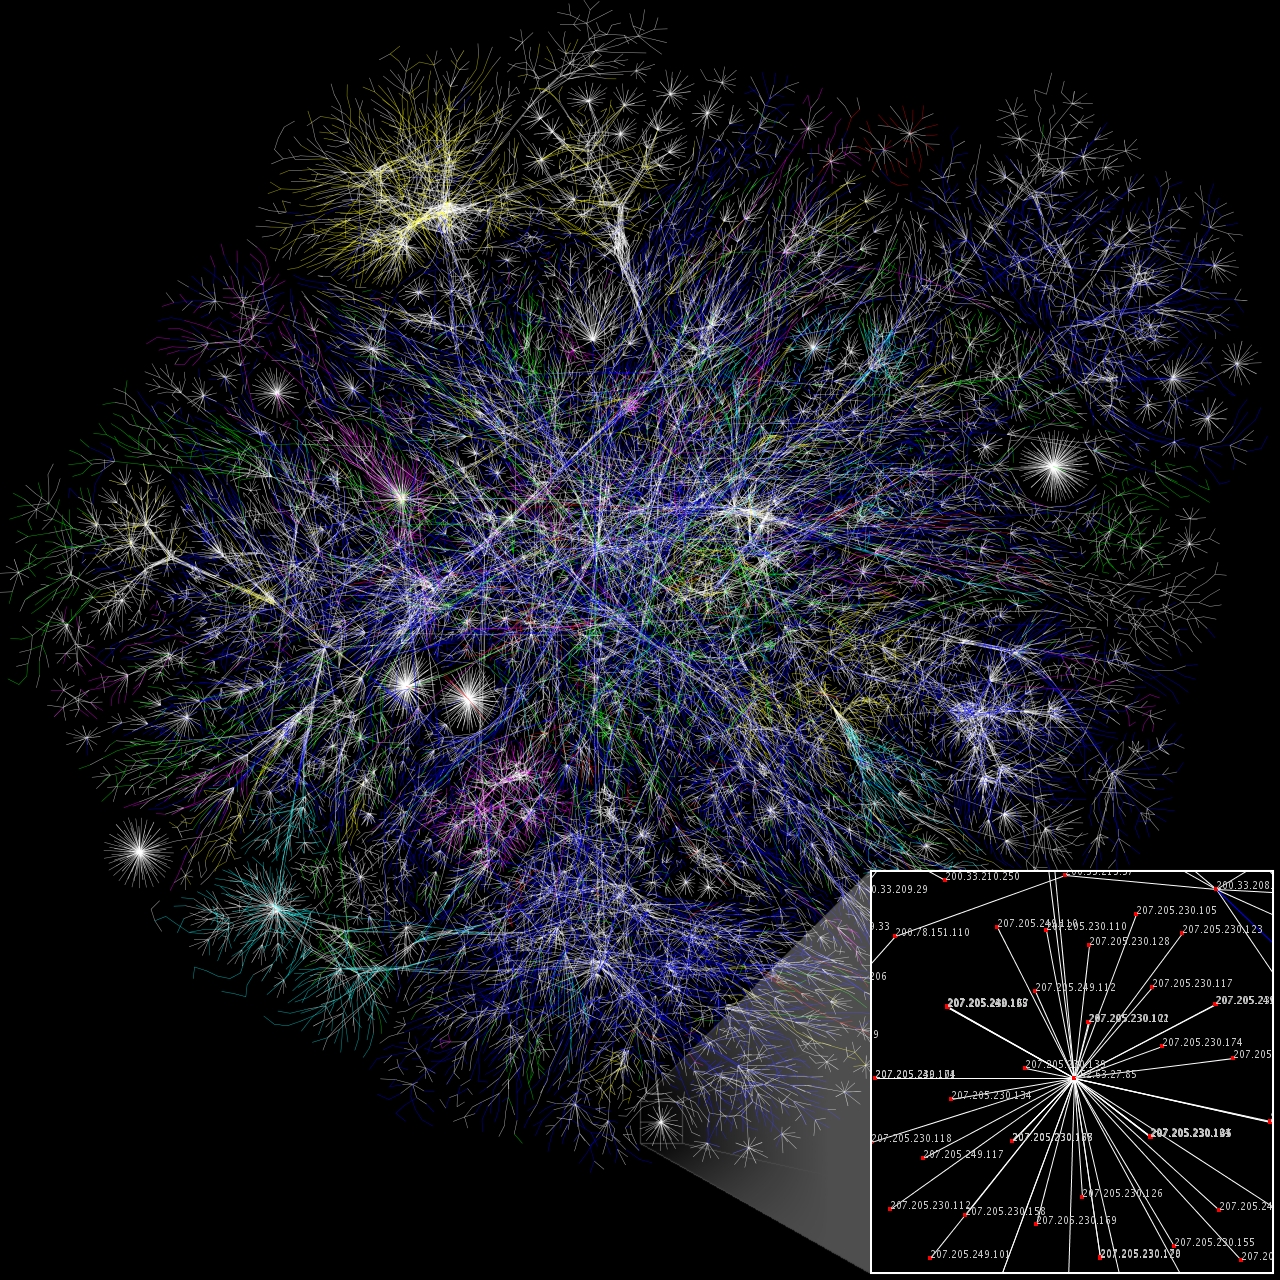
A network needs connections and quantities
A network diagram represents locations as nodes and connections as edges. For water, the useful labels may include flow direction and volume per unit time. A line shows a possible route; it does not by itself specify the amount moving along it.
Volume flow rate describes how much volume passes a chosen point in an interval. Litres per minute is a rate, while litres is an amount. Keeping those units separate prevents a map of pipes from becoming a collection of numbers with no clear meaning.
State the conservation boundary
At a steady junction with incompressible water, no leak and no accumulating storage, total incoming volume flow equals total outgoing volume flow. The assumptions matter: if a tank is filling, inflow and outflow need not be equal at every moment.
The continuity rule does not tell you how a real network divides its flow among branches. Pressure differences, resistance, geometry and other conditions matter. Equal-looking lines on a page are not evidence that the flow splits equally.
Worked example: a junction and a tank
A fictional junction receives 12 L/min and sends 7 L/min along branch A. Under the stated no-storage model, branch B carries 12 − 7 = 5 L/min. Over three minutes, the two outgoing amounts are 21 L and 15 L, totalling 36 L, equal to the 36 L incoming amount.
In a separate invented tank, inflow is 12 L/min and outflow 9 L/min. Starting with 20 L and keeping those rates constant for three minutes gives a net gain of 3 × 3 = 9 L, so storage becomes 29 L. This assumes enough tank capacity and no other losses; it is a paper ledger, not plumbing guidance.
Use disagreement to ask a better question
If a record says 12 L/min enters while only 10 L/min leaves, first check units, timing, storage and measurement limits. A 2 L/min difference is a question to investigate, not automatic proof of a leak. A changing boundary or incomplete record can explain an apparent imbalance.
All values and networks here are fictional. You can practise conservation and unit reasoning without opening valves, collecting water, visiting infrastructure or assuming any water is safe to use. A clear boundary is more useful than a detailed-looking pipe picture with unexplained numbers.
Only if you feel like trying
Draw and balance two paper networks
- Draw the supplied junction and label both branches in L/min.
- Make a separate three-minute tank ledger with starting volume, total inflow, total outflow and ending volume.
- Change one assumption, such as storage or a missing branch, and explain which equality would need revision.
Optional. Use paper or talk through the supplied fictional example. No purchase, personal information, account, public sharing or practical experiment is needed.
Look at the sources.
These references offer further reading on the ideas here. Check who published them, what they support and what you would ask next.
- OpenStax / Rice University12.1 Flow Rate and Its Relation to Velocity
Research checked 1 November 2026. External pages have their own content and privacy practices.
Where could this connect?
These are editorial links between subjects. You choose which, if any, to follow.
Engineering
Engineering networks combine a connection diagram with conservation and realistic boundary assumptions.
Follow this connection
Ratio & Proportion
Litres per minute is a rate, so amounts require multiplication by elapsed time.
Follow this connectionTransport Networks & Routes
A connection map and the amount carried on each route describe different parts of a network.
Follow this connection