
A little room to wonder
Constellations & Sky Patterns
Separate a pattern on the sky from a group in physical space, and read the viewpoint behind a star chart.
Do neighbouring dots on a sky chart mean neighbouring stars?
A pattern is a view
A sky chart compresses directions onto a page. Two points can look close because their directions from Earth are similar, even when one star lies much farther away. The chart records where to look, not a flat board to which stars are attached.
A familiar dot-to-dot figure is a selected pattern. In modern astronomy, a constellation also names a defined region of sky; all directions within its boundary belong to that region, not only the bright dots used in a picture. There are 88 formally recognised regions.
Keep location and time with the chart
The visible part of the sky changes with location and time. Earth’s rotation changes which directions are above the horizon during a night; its yearly orbit changes the night-time view across seasons. An Australian chart and a northern chart need not show the same view.
Even a correct chart can confuse if its date, direction or projection is missing. Charts are conventions for organising observations. A line joining two stars is a drawing choice, not a glowing connection between the physical stars.
Worked example: give a flat pattern depth
On an invented direction grid, place star A at (2, 2), B at (3, 2) and C at (3, 5). A and B are one grid unit apart on the drawing; B and C are three. These are chart spacings, not distances measured in kilometres or light-years.
Now add fictional Earth-distance labels: A is 40 light-years away and B is 400 light-years away. B’s label is ten times A’s, despite the neighbouring dots. Neither the chart spacing nor this distance ratio tells you their exact three-dimensional separation without their angular directions.
Distinguish description from an invented story
Different observers can connect the same dots differently. An invented paper pattern is fine when it is labelled as your invention. It should not be presented as an existing scientific constellation or attributed to a community whose knowledge you have not consulted.
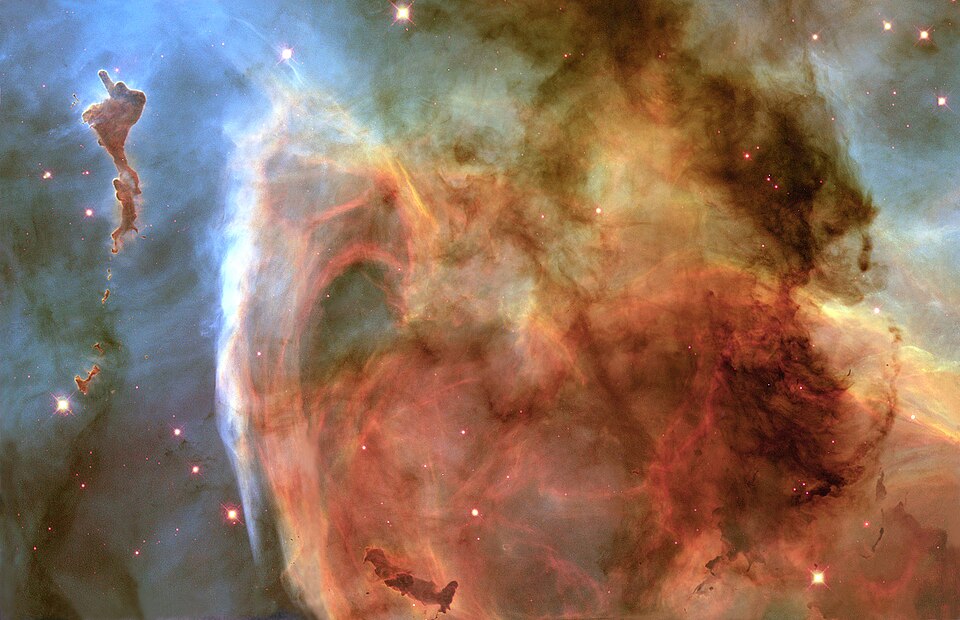
A photograph contains more information than a simple chart, including brightness and surrounding objects, but it still projects depth. Use a labelled chart for directions, distance evidence for depth and a source for the naming system; no single image supplies all three.
Only if you feel like trying
Give the same dots two explanations
- Plot the three fictional grid points from the example.
- Draw two different connecting patterns, then add the fictional distance labels in a separate key.
- Write one statement your grid supports and one physical-distance claim it cannot support.
Optional. Use paper or talk through the supplied fictional example. No purchase, personal information, account, public sharing or practical experiment is needed.
Look at the sources.
These references offer further reading on the ideas here. Check who published them, what they support and what you would ask next.
- NASA Space PlaceWhat Are Constellations?
- Lunar and Planetary Institute / USRAAbout Constellations
Research checked 1 November 2026. External pages have their own content and privacy practices.
Where could this connect?
These are editorial links between subjects. You choose which, if any, to follow.
Astronomy
Astronomy uses sky patterns to organise directions while testing explanations about objects in space.
Follow this connection
Coordinates & Graphs
Coordinates make a page position explicit, but axes and units determine what that position means.
Follow this connectionGalaxies & Cosmic Scale
Both topics distinguish apparent closeness in a picture from physical distance.
Follow this connection