
Mathematics · Investigate
Two charts from the same invented table
Which display choices change an impression without changing the values?
Display the same fictional token counts with two labelled scales, and separate a visual impression from a numerical difference.
15–25 minutes, or one comparison for a first try. More time is optional.
Start here
Write this fictional table: token type A = 8, B = 10, C = 12. These are invented token counts, not responses from people.
Use your idea or the example below. Talk, write, draw, point or listen first. You can stop after one step.
Try it your way.
Make the first display
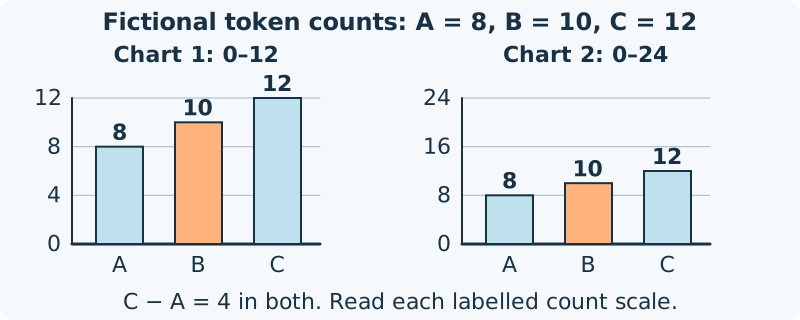
Draw a bar chart with three equal-width bars labelled A, B and C. Use equally spaced marks 0, 4, 8 and 12 on the count axis; all bars begin at zero.
Change only the scale range
Draw the same-size plotting area again. Use marks 0, 8, 16 and 24, still equally spaced and starting at zero. Plot the same three counts, keeping labels, bar widths and order unchanged.
Read values before impressions
Read each bar against its own scale. C exceeds A by 12 − 8 = 4 tokens in both charts. C is 12 ÷ 8 = 1.5 times A, regardless of the changed display range.
Choose and explain
Say which chart makes the values easier to read for your purpose, and why. A bar looks half as tall on the second scale, but its labelled count has not halved. Keep both scales visible.
One possible version
Invented table: 8, 10 and 12
This original comparison uses the same fictional data twice. Both count axes begin at zero; neither chart reports a survey.
- Chart 1 ranges from 0 to 12; chart 2 from 0 to 24 in an equally tall plotting area.
- The bars in chart 2 are half the drawn height of the corresponding bars in chart 1. Both still represent A = 8, B = 10, C = 12.
- The total is 30 tokens, and C − A = 4 tokens on either chart.
Different scales can change an impression. These diagrams do not establish what every viewer notices, or make an unlabelled or cut-off bar axis acceptable.
Something to keep?
Did I read the axis before judging the size of the difference?
You can keep a question, a sketch or a change of mind. A finished product is optional.
This opens an editable starter in your project tools. It asks before replacing open work. Choosing it does not save or share your work automatically.