
A little room to wonder
Cells & Microscopy
Microscopes reveal structures too small for unaided vision. Interpreting a micrograph requires a scale, an imaging method and a distinction between seeing and inferring.
How can you estimate a cell’s size when the picture has been enlarged?
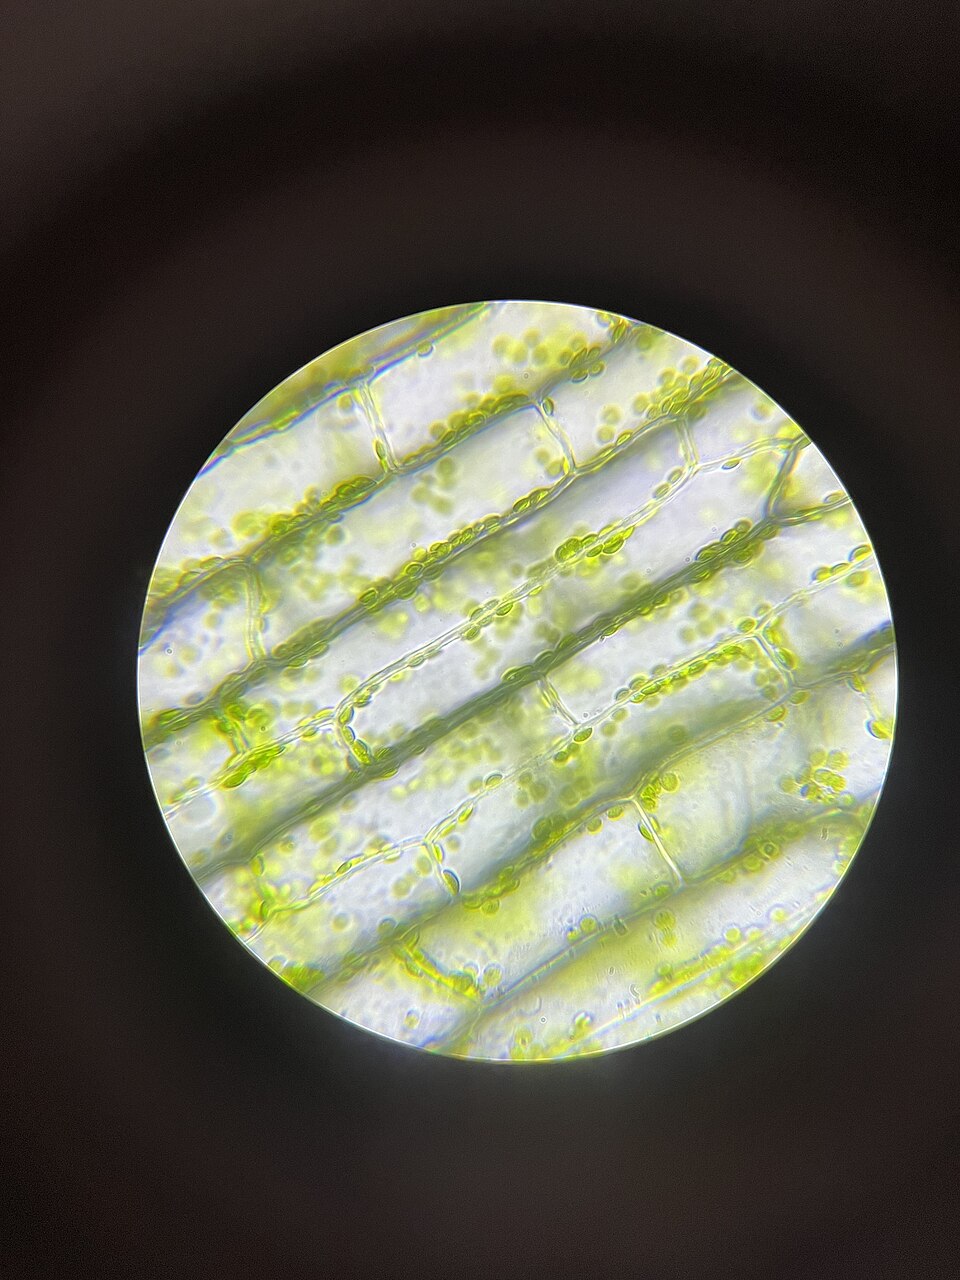
A cell is an organised living system
Cells have a boundary and carry out processes that sustain life. Some organisms consist of a single cell; others contain many cells with specialised functions. A plant cell is not just a little green box: its membrane controls exchanges, while structures within it perform different tasks.
Typical eukaryotic cells, including plant and animal cells, have a nucleus and other membrane-bound structures. Bacterial cells have a different organisation. A familiar labelled plant-cell diagram is therefore a model of one kind of cell, not a universal template for all life.
Magnification and resolution answer different questions
Magnification tells you how much larger an image appears than the object. Resolution concerns whether two nearby features can be distinguished separately. Enlarging an image on a screen increases its displayed size without necessarily revealing new detail.
Light microscopes use visible light. Electron microscopes use a different imaging method and can reveal smaller structures, but their preparation and images must be interpreted accordingly. Colour may come from the specimen, a stain or later processing; it should not be assumed to represent an unaltered living view.
Worked example: use the bar, not the page size
In a fictional micrograph, a scale bar labelled 20 micrometres measures 4 millimetres on a print. A cell’s long axis measures 12 millimetres on the same print. The cell is three scale bars long because 12 ÷ 4 = 3. Its estimated length is therefore 3 × 20 = 60 micrometres.
Enlarge the print to twice its size: the bar becomes 8 millimetres and the cell 24 millimetres. Their ratio remains 3, so the estimate stays 60 micrometres. A printed “400×” label would no longer describe the enlarged print accurately. The bar travels with the image and preserves the comparison. These invented measurements do not calibrate the Elodea image on this page.
An observation is not every possible explanation
A dark spot might be a structure, overlapping material or an imaging artefact. A labelled reference and further observations can help distinguish possibilities. One still image also cannot establish movement, growth or a sequence of events.
Record the source, method and scale when they are available; state when they are missing. You can practise entirely with supplied images and fictional measurements. There is no need to sample body material, grow microorganisms or prepare slides with sharp tools.
Only if you feel like trying
Resize a fictional micrograph
- Draw a bar labelled 10 micrometres and a simple cell outline three bars long.
- Make a second version twice as large. Calculate the cell estimate in both versions.
- Write one visible feature and one question that the drawing cannot answer.
Optional. Work on paper, point to the example or talk it through. No account, purchase or public sharing is needed.
Look at the sources.
These references informed this introduction. You can check who published them, what evidence they use and whether you would ask another question.
- OpenStax, Rice UniversityBiology 2e: Studying Cells
- OpenStax, Rice UniversityBiology 2e: Eukaryotic Cells
Research checked 1 November 2026. External pages have their own content and privacy practices.
Where could this connect?
These are editorial links between subjects. You choose which, if any, to follow.
Biology
Cell organisation connects small structures with the functions of living organisms.
Follow this connection
Light & Optics
A microscope’s image depends on how its lenses and illumination handle light.
Follow this connectionMaps & Scale
A scale bar preserves a distance relationship when an image changes display size.
Follow this connection