
A little room to wonder
Planetary Surfaces & Landforms
Use shapes, scale and overlapping features to investigate a planetary surface without treating one image as a complete history.
How can a surface image preserve clues about events that happened earlier?
Describe the visible feature first
A surface image can show a roughly circular depression, a branching channel or a broad smooth area. Start with that description before proposing how it formed. Impacts, volcanic activity, crustal movement and erosion can produce different landforms, sometimes modifying the same surface more than once.
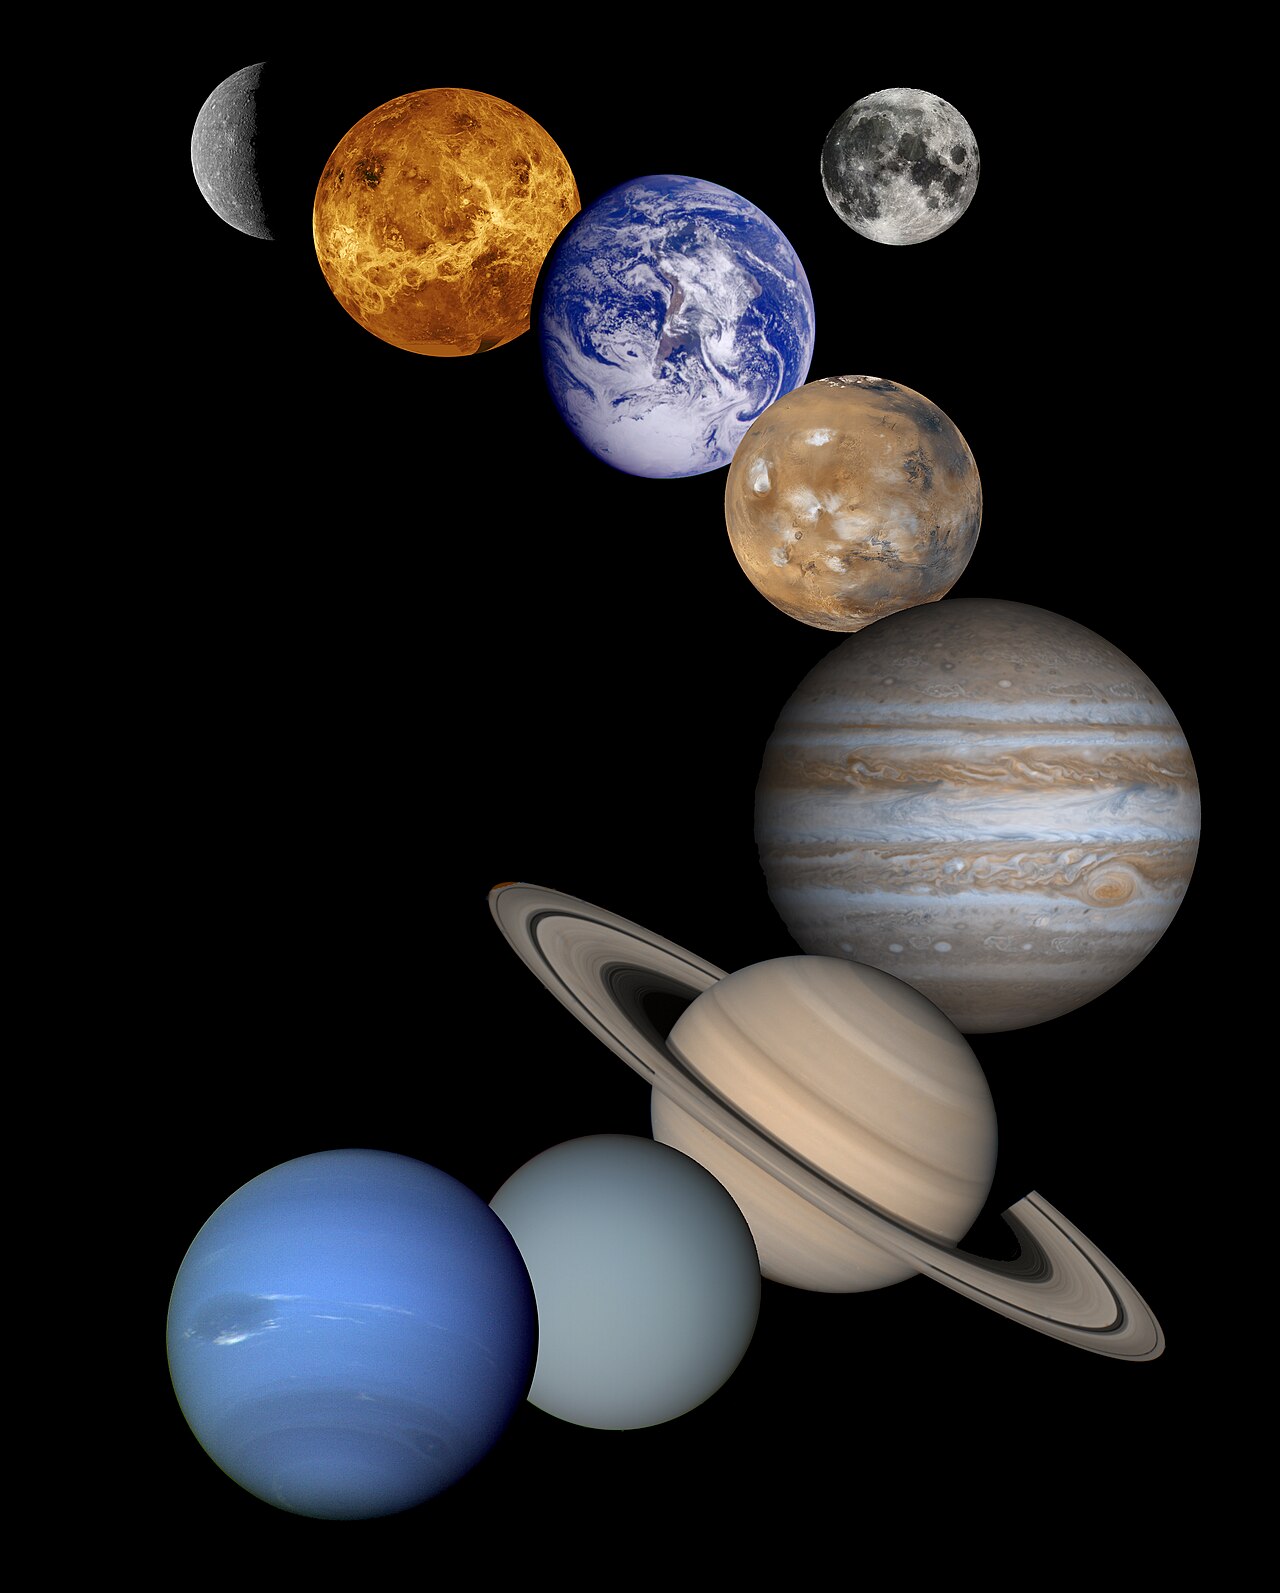
The Moon preserves many impact craters and older lava-filled basins. Mars has craters, volcanoes, canyons and other surface features. These observations make comparison useful, but the same-looking outline does not guarantee an identical formation history on every world.
Measure using the image scale
An image’s scale relates a distance on the page to a distance on the surface, for the stated view. A wider image does not necessarily show a larger feature if its scale is different. Camera angle, shadows and image processing can also change which edges are easy to recognise.
Relative order can sometimes be inferred from overlap. A feature cutting across another can indicate a later event, provided the interpretation is supported. An isolated shadow is not a depth measurement, and colour alone does not identify a material or date its formation.
Worked example: compare two invented map areas
Two fictional map squares each represent 10 km by 10 km, so each covers 100 km². Square A has 12 clearly mapped craters above a chosen size; square B has 3. Their counts are 0.12 and 0.03 craters per km² under that counting rule.
A has four times B’s mapped crater density, because 12/3 = 4 for equal areas. This suggests a question about surface history, not a numerical age. Different resurfacing, image quality and counting thresholds could affect the comparison; more craters alone is not a universal dating formula.
Keep the inference narrower than the picture
Comparisons need consistent area, scale, resolution and feature definitions. Counting every small mark in one image but only large circles in another produces an unfair result. Record uncertain features rather than quietly assigning them to whichever answer you expected.
A useful interpretation can distinguish observation, calculation and hypothesis: “12 mapped circles”, “0.12 per km²”, and “perhaps a longer preserved impact record”. Those are three different kinds of statement. Keeping them separate lets later evidence revise the explanation without losing the original observation.
Only if you feel like trying
Annotate an invented surface map
- Draw two equal map squares with 12 and 3 circles, each above the same stated symbol size.
- Label scale and calculate each area and count per area.
- Write one observation, one calculation and one possible explanation. Add a competing explanation or missing piece of evidence.
Optional. Use paper or talk through the supplied fictional example. No purchase, personal information, account, public sharing or practical experiment is needed.
Look at the sources.
These references offer further reading on the ideas here. Check who published them, what they support and what you would ask next.
Research checked 1 November 2026. External pages have their own content and privacy practices.
Where could this connect?
These are editorial links between subjects. You choose which, if any, to follow.
Astronomy
Planetary landforms use observations to investigate the physical history of worlds.
Follow this connection
Landforms & Processes
Different processes can modify a landscape, so shape is evidence to interpret rather than a complete explanation.
Follow this connectionMaps & Scale
A scale and equal comparison areas are essential before counting or measuring surface features.
Follow this connection