
A little room to wonder
Water Cycles & Catchments
A catchment gathers water towards a chosen outlet. Mapping its boundary and connected tributaries helps explain how local flows combine without assuming all rainfall immediately reaches a river.
Why can adding two tributary readings twice make a catchment account look larger than its inputs?
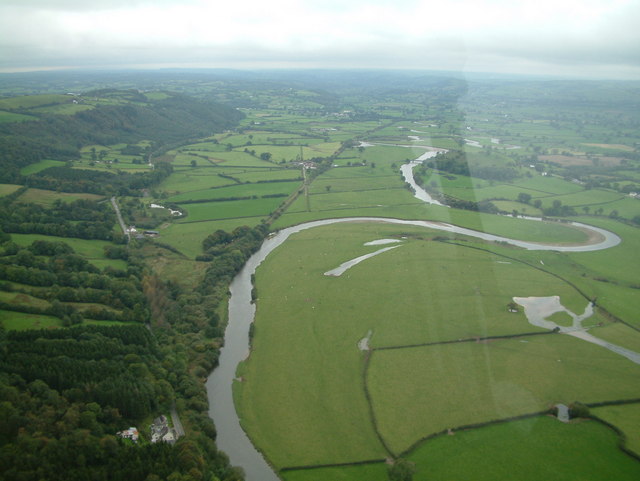
Choose the outlet before the boundary
A catchment, also called a watershed or drainage basin, is an area associated with drainage towards a shared outlet. Small catchments can sit within larger ones. A creek junction and the river mouth therefore define different study areas, even when both are part of the same wider network.
Water may run over the surface, enter the ground or remain in storage. A simple drainage diagram selects some of these pathways. It is useful when its boundary and interval are explicit; it should not imply that every unit of rain instantly appears at the outlet.
Worked example: combine tributaries once
On a fictional map, subcatchment A contributes six model flow units and B contributes four during one interval. They join at J, where the combined input is ten. A separate branch C contributes three downstream. With no other gains, losses or storage changes in this invented account, the final outlet receives thirteen units.
Adding A, B, J and C would give twenty-three, but this counts the first ten twice: once in the branches and again after their junction. Thirteen is the correct total under the stated assumptions. If two units then remain in a pond downstream, only eleven reach the outlet during that same interval.
Stores explain timing differences
A tributary input and an outlet flow need matching periods and units before they can be compared. Water stored during one interval may leave in a later interval. A delayed arrival is different from an accounting error. A model should identify whether its arrows represent amounts over a period or rates at an instant.
Landform boundaries help describe surface drainage, while real groundwater can have more complex paths. The paper model deliberately leaves those paths out. Marking an omission is clearer than adding a mysterious balancing number just to make an equation work.
Keep the cycle wider than the drawing
The water cycle connects stores and transfers at many scales. A catchment diagram is one selected view of those connections, not a single journey that every water molecule must complete in order. Changing the outlet changes which area is included in the account.
You can explore the entire example as boxes, arrows and invented units. The river photograph is a real setting, not a measurement of the supplied flows. No visit, water sample, mapping of your home or external data submission is needed.
Only if you feel like trying
Find a double count
- Draw A and B joining at J, with C joining farther downstream. Label all supplied invented amounts.
- Calculate the final outlet amount without counting the junction twice. Then include two stored units and recalculate.
- Choose J as the new outlet. Circle which branches now belong in the smaller account and explain the boundary change.
Optional paper network exercise using fictional waterways. No collecting water, visiting a site or recording private locations.
Look at the sources.
These references offer further reading on the ideas here. Check who published them, what they support and what you would ask next.
- NOAA National Ocean ServiceWhat is a watershed?
Research checked 1 November 2026. External pages have their own content and privacy practices.
Where could this connect?
These are editorial links between subjects. You choose which, if any, to follow.
Geography
Geography links land shape and water movement; a catchment defines the area connected to a chosen outlet.
Follow this connection
Water in Ecosystems
Water retained in a local habitat can be one store within a wider catchment account.
Follow this connectionWater Networks & Flow
Junctions and flows need clear boundaries to avoid counting the same transfer twice.
Follow this connection