
Astronomy · Investigate
Find a pattern in an invented star signal
What might a repeated dip suggest, and what would still need checking?
Read a complete invented brightness series, identify a recurring gap and distinguish a pattern from a confirmed planet.
15–25 minutes, or three data points for a first try. More time is optional.
Start here
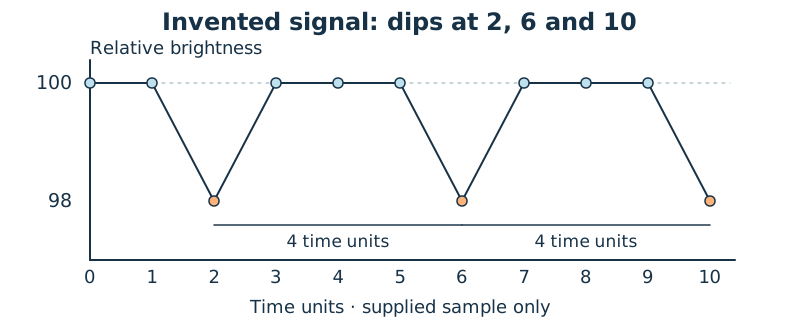
Use times 0 to 10. Brightness is 100 units at every time except 2, 6 and 10, where it is 98 units. These numbers form an invented signal.
Use your idea or the example below. Talk, write, draw, point or listen first. You can stop after one step.
Try it your way.
Put the numbers on a graph
Draw time on the horizontal axis and relative brightness on the vertical axis, or read the supplied graph. Include every time 0, 1, 2, 3, 4, 5, 6, 7, 8, 9, 10.
Find what repeats
Mark the three low readings. The gaps are 6 − 2 = 4 and 10 − 6 = 4 time units. Say ‘two equal gaps in this sample’, rather than claiming an endless pattern.
Make a conditional prediction
If the same spacing continues, the next dip would be at 14. Mark this as a prediction outside the supplied data, not another measured point.
Keep cause open
A transit can cause a dip in a real star’s measured light, but this invented pattern cannot confirm a planet. Name a next check, such as more readings and independent checks of the signal.
One possible version
Invented data: three dips
The complete series for times 0 through 10 is 100, 100, 98, 100, 100, 100, 98, 100, 100, 100, 98. Units are arbitrary.
- Low readings occur at 2, 6 and 10.
- The observed sample gaps are 4 and 4 time units.
- 14 is the next predicted dip only if that pattern continues; no value at 14 is supplied.
The dataset is made up, so it is not a discovery. Repeating dips in actual observations would still need investigation and confirmation.
Something to keep?
Where did my description of supplied data become a prediction?
You can keep a question, a sketch or a change of mind. A finished product is optional.
This opens an editable starter in your project tools. It asks before replacing open work. Choosing it does not save or share your work automatically.